Gallery
Animations
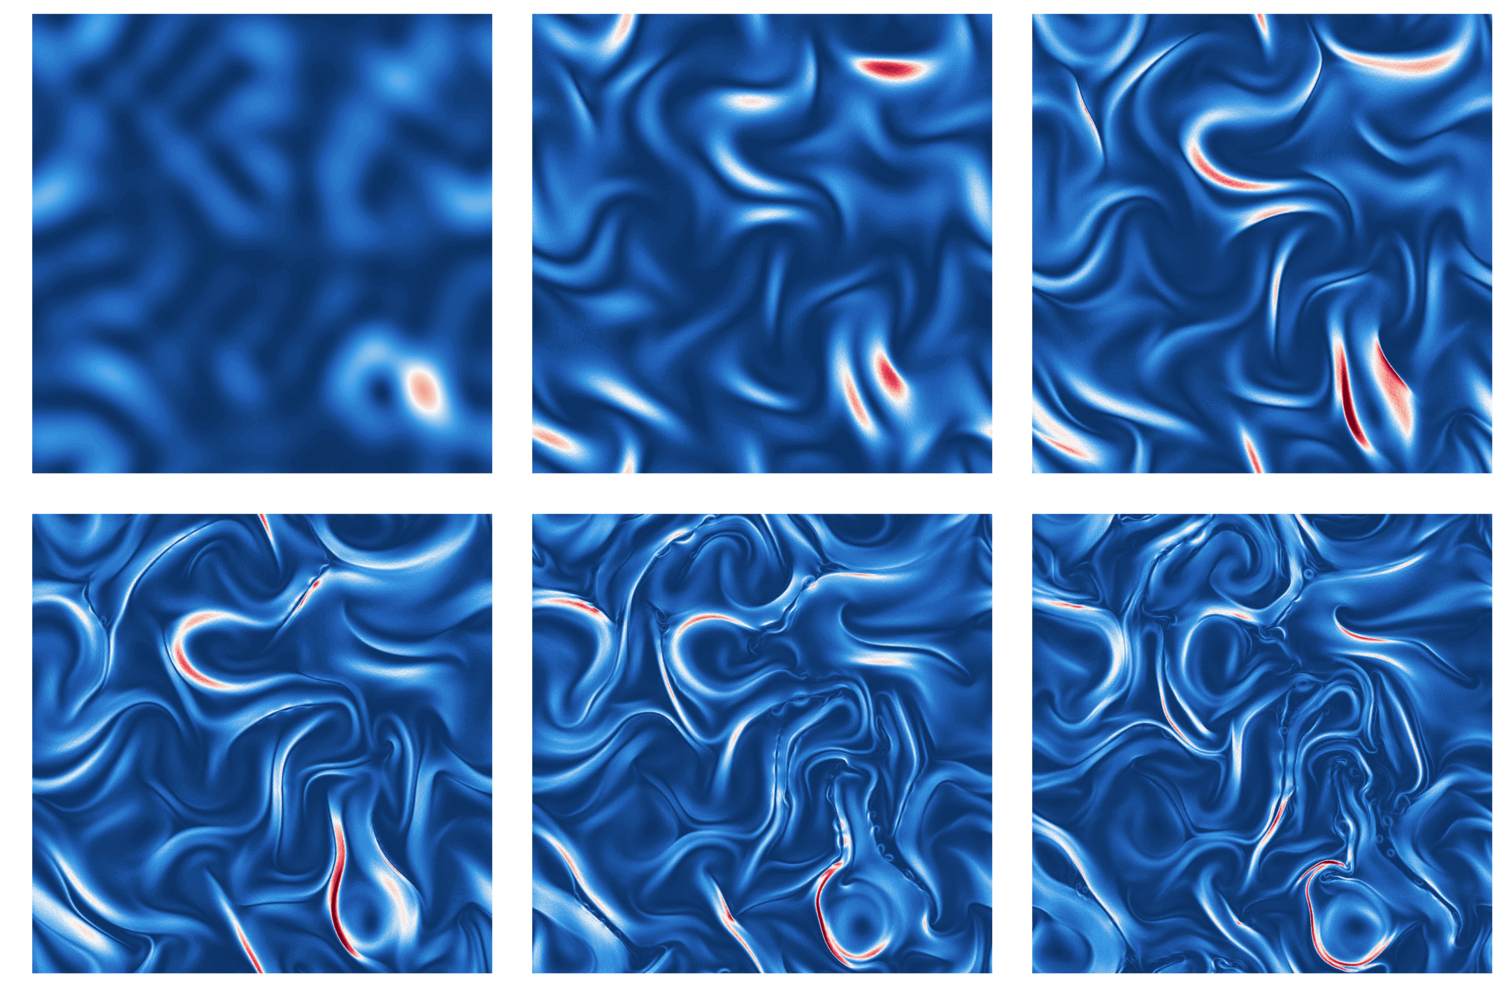
The following animation shows the perpendicular (in-plane) magnetic field amplitude during a simulation of decaying turbulence.
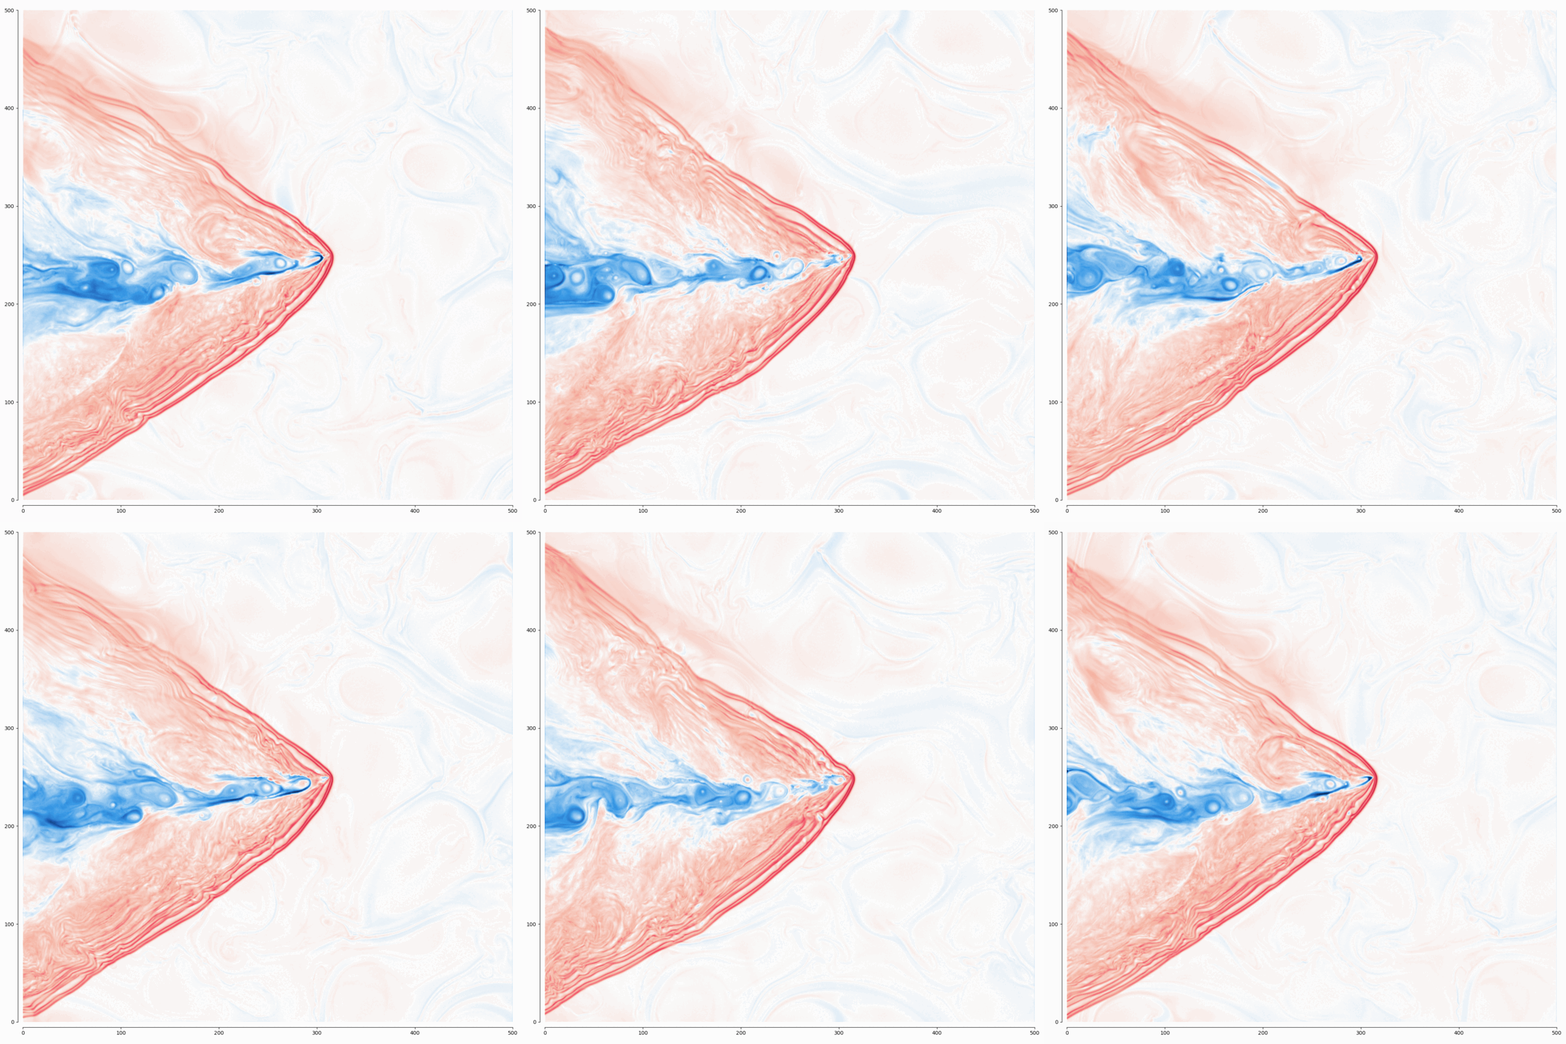
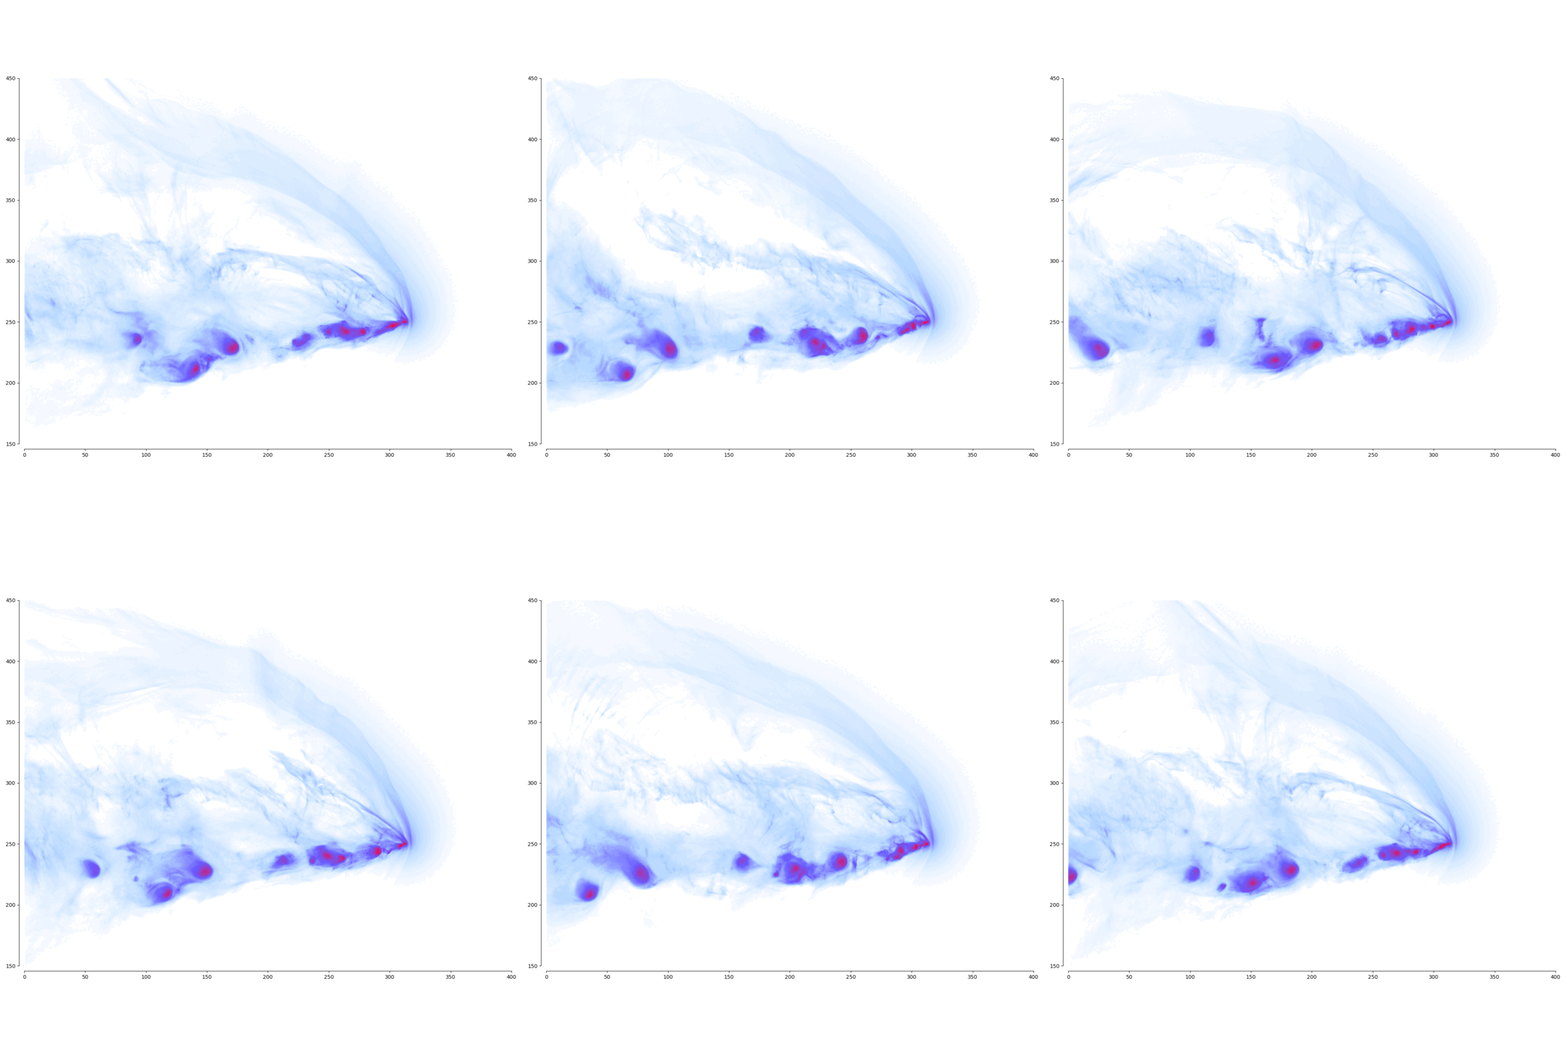
The next two animations show the interaction between a medium activity comet and a turbulent solar wind. The first animation shows the solar wind density while the second provides the cometary ion density, both in logarithmic scale.
The next animation shows the in-plane magnetic field lines using a LIC representation, coloured using the amplitude of the same in-plane field.
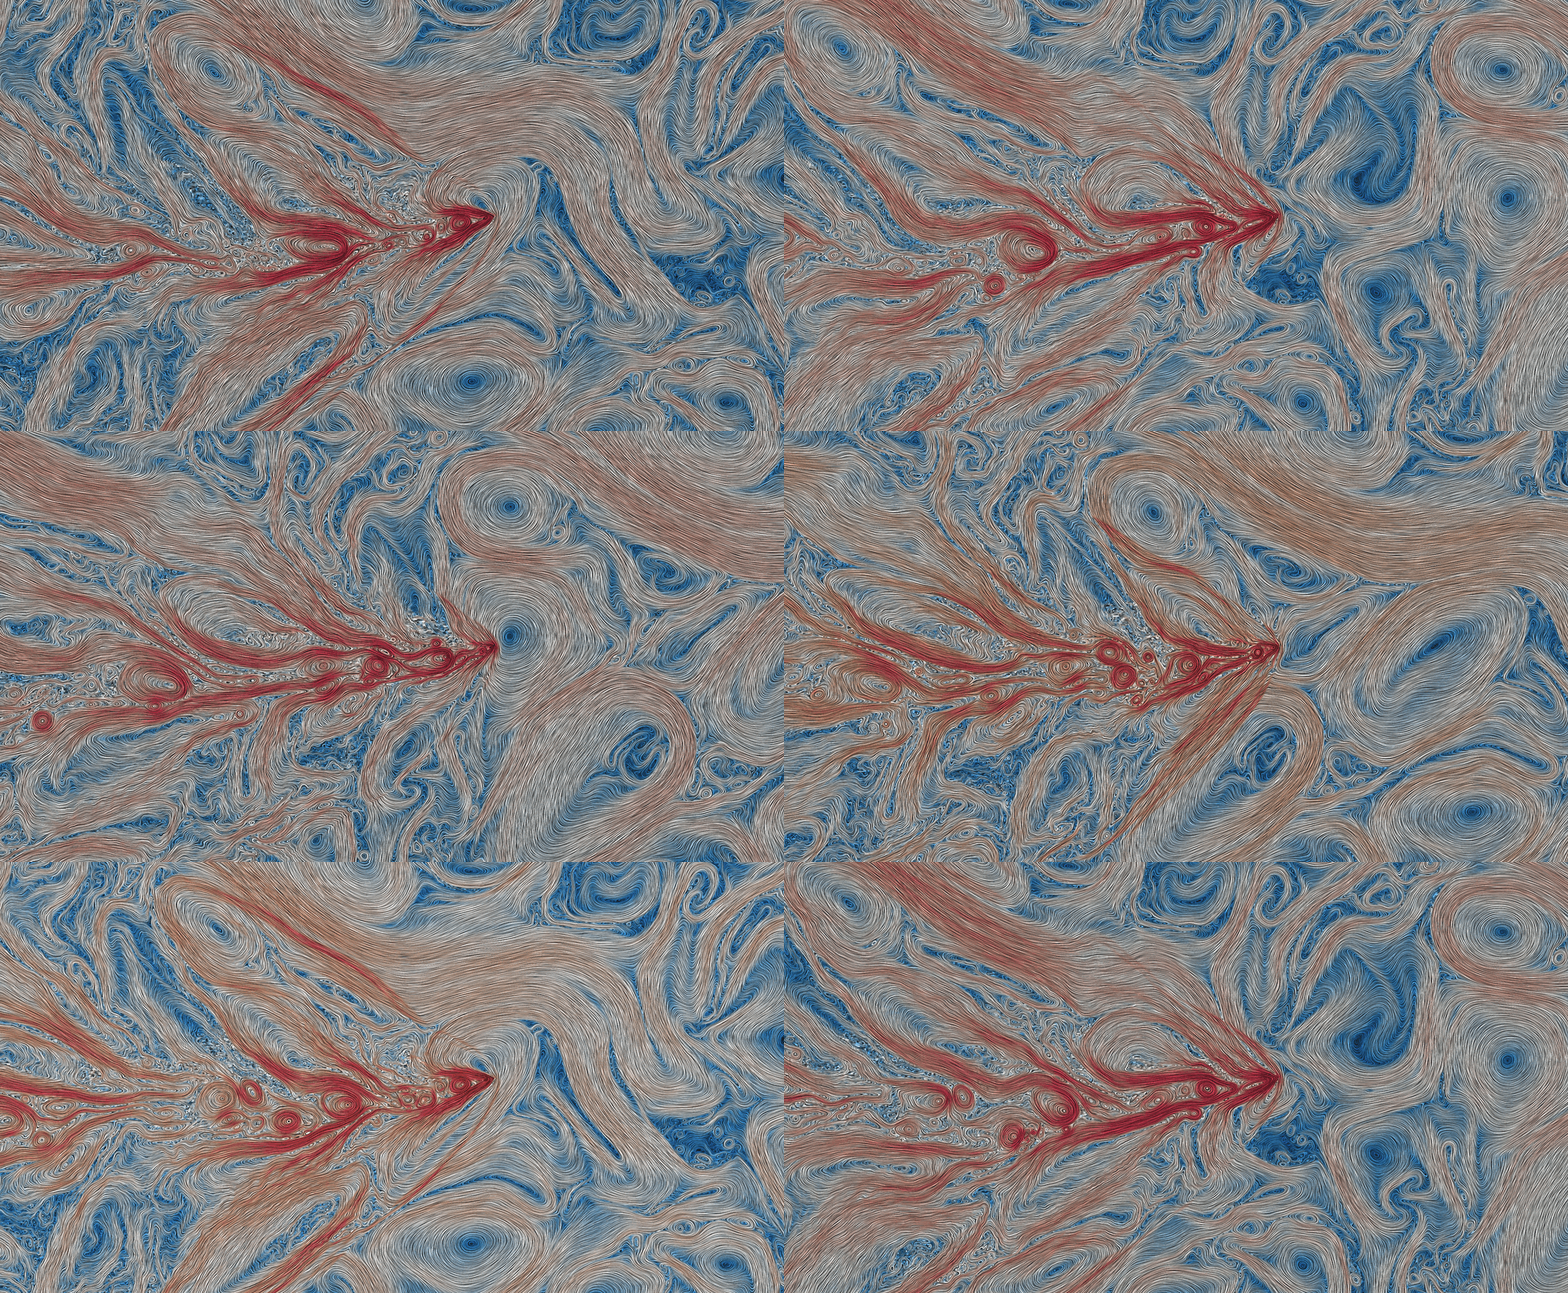
The following one presents the perpendicular (in-plane) magnetic field using a log10 scale for the amplitude. The obstacle is now an ionosphere, similar to the situation found at Mars.